|
Temperature Curve |

|

|
|
|
Temperature Curve |
|
|
Temperature Curve
|
Temperature Curve |
|
|
|
|
Temperature Curve |
|
|
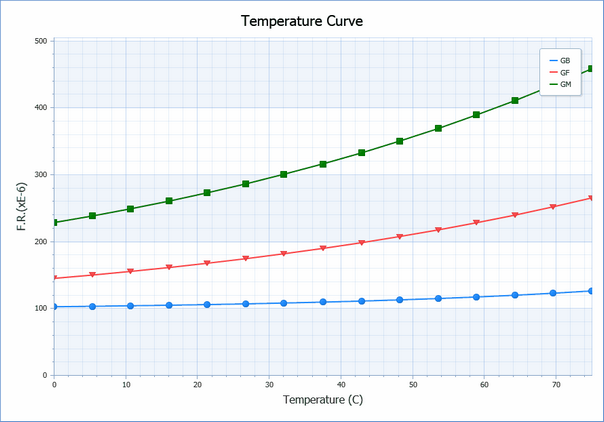
Temperature curve reports show the influence of temperature on a project’s reliability. You can view the temperature curve results for several environments simultaneously, in graph or text form.
RAM Commander’s series of temperature curve reports provides many ways to look at failure rates with variation in temperature. You can review a project’s failure rates for one or more environments, or generate a report for selected project items.
To view a Temperature Curve Report:
| 2. | Navigate to the desired level in the Product tree. Note: Like all reports, temperature curve reports are level-specific. Select the desired level in the product tree before running the report. |
| 3. | From the Reports menu, choose Temperature Curve; the Temperature Curve dialog box opens. |
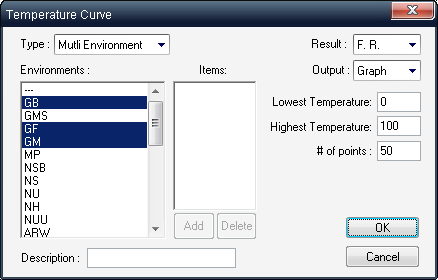
| 4. | Enter an optional report description. |
| 5. | Select a report type in the Type list box. |
| • | If you selected Multi Environment in the Type list box, make one or more selections from the Environments list box. |
| • | If you selected Multi Item in the Type list box, choose the Delete button to remove items from the Item list, or choose the Add button; the Select Tree item dialog box opens. Select an item from the tree and choose OK. Repeat to add more items. |
| 6. | In the Result field, select F.R. for failure rate or MTBF for mean time between failures. |
| 7. | In the Output field, select Text or Graph. |
| 8. | In the Lowest Temperature and Highest Temperature fields, enter the lowest and highest temperatures to be included in the report. |
| 9. | Enter the number of temperature points in the # of points field. (The number of temperature intervals equals the number of points minus 1.) |
| 10. | Choose OK. |
The text or graph versions of the Temperature curve report will appear - the example below shows Multi-Environment FR curves for GB, GF and GM environments between 0 and 100 degrees: