|
Graphs |

|

|
|
|
Graphs |
|
|
Graphs
|
Graphs |
|
|
|
|
Graphs |
|
|
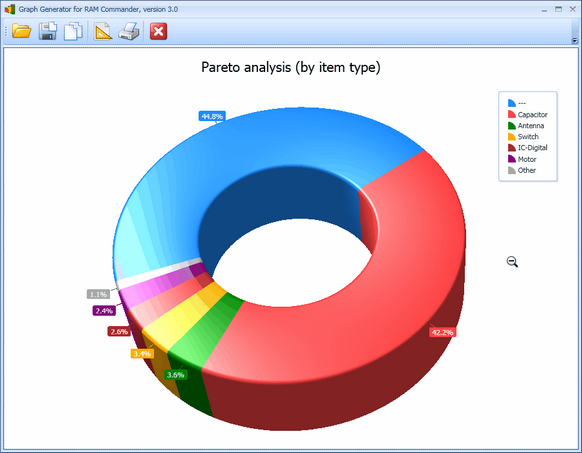
RAM Commander provides a convenient graphics package that offers a wide variety of graph types. The report may be viewed using 2D and 3D bar, pie, line graphs in a variety of customizations.
Different RAM Commander modules provide different graphs - like Pareto in Reliability prediction or "Unavailability curve" in FTA module. See particular module chapter for more information.
Once the graph is displayed in the Graph View dialog box, its appearance may be changed - press the "Setup" button and make required selections on the graphs setup dialog.
To print the graph, press the "Print" button on the Graph View dialog box.
Export the graph as image using the "Save" button.
Choose "Clipboard" button to place the graph image to the clipboard. Then you may switch to another application like MS Word and paste the graph to your document.
Press the "Close" button to return back to RAM Commander main window.
You may also zoom in/out the graph using mouse wheel and rotate the graph using mouse pointer and left button to achieve the desired presentation of the graph.