|
Reliability Growth |

|

|
|
|
Reliability Growth |
|
|
Reliability Growth
|
Reliability Growth |
|
|
|
|
Reliability Growth |
|
|
RAM Commander’s reliability growth module is based on the Duane method described in MIL-STD-1635. Reliability growth analysis is appropriate when you have limited reliability data on your project. In such cases, you can use the limited data to extrapolate what the reliability data would be if the testing were conducted over long periods of time.
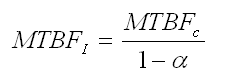
The Duane model is the most widely used method for reliability growth planning, testing and tracking. In this model, as long as the effort to improve the reliability of electronic equipment continues, the tested system MTBF is proportional to Tα, where T is the cumulative operating time and α is the rate of growth. The cumulative mean time between failures MTBFc is measured during testing and then divided by (1-α) to convert it to the current instantaneous MTBFi, i.e., the instantaneous MTBF (MTBFI) is calculated as follows:
MTBFc is plotted versus cumulative test time on Log-Log paper, where the growth regression is a straight line with slope coefficient α. The test time at which the growth line reaches the required MTBF (MTBFR) is the expected duration of the Reliability growth test:
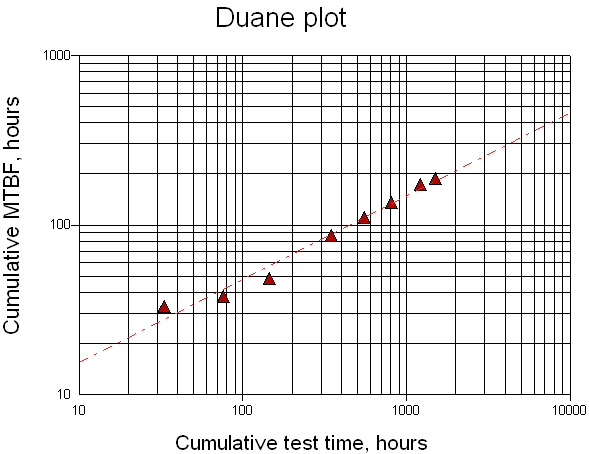
The graph above is created using the following sample failure data set:
Point # |
Time, hours |
Cumulative MTBF, hours |
|---|---|---|
1 |
33 |
33 |
2 |
76 |
38 |
3 |
145 |
48.3 |
4 |
347 |
86.8 |
5 |
555 |
111 |
6 |
811 |
135.2 |
7 |
1212 |
173.1 |
8 |
1499 |
187.3 |
Module Features:
| • | The default values of MTBFi and Initial test time for Reliability Growth Planning are defined in accordance with MIL-STD-1635. |
| • | The default MTBF/R values for each project item are those predicted by the RAM Commander. |
| • | Reliability Growth calculation can be performed for the whole system, for any subsystem, or even for an external item that doesn't belong to the current project. |
| • | Reliability Growth Test plan and expected remaining time to test accomplishment are presented. |
| • | Calculation of a Confidence Interval for a selected Confidence Level using the new Bootstrap technology. (A new statistical technology named “Bootstrap” reproduces the origin sample as many times as necessary, and all new samples have absolutely identical statistical properties). |
| • | Reports for all failures available or only for the last N reported failures. |
| • | Tabular or graphic report presentation. |
See next paragraph for a theoretical discussion of reliability growth.