|
To initiate a Monte Carlo simulation |

|

|
|
|
To initiate a Monte Carlo simulation |
|
|
To initiate a Monte Carlo simulation
|
To initiate a Monte Carlo simulation |
|
|
|
|
To initiate a Monte Carlo simulation |
|
|
| 1. | Activate the RBD diagram window. |
| 2. | From the RBD menu, choose Monte Carlo configuration: |
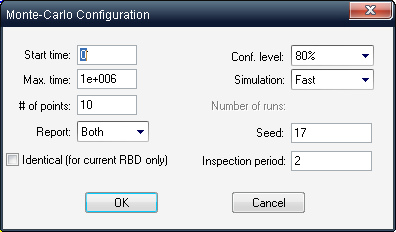
| 3. | In the Monte Carlo Configuration dialog box, enter the configuration values: |
Start time |
Starting time for collection of results. (The simulator always starts at time t = 0.) |
|
Max Time |
Elapsed time for collecting results |
|
# of points |
Number of intervals in output graph |
|
Report |
Text, graph or both |
|
Identical |
If selected, simulation assumes that if multiple blocks are identical (have the same Ref.Des. value) it is actually the same single block even if it appears multiple times on the diagram. |
|
Conf. Level |
Confidence level of the output |
|
Simulation |
Fast (least number of iterations = 100), Intermediate (medium number of iterations = 1000), Accurate (most number of iterations = 10000), Custom - number of iterations defined by user |
|
Seed |
Seed for random number generator |
|
Inspection period |
Inspection Period value = 0 |
Element sent to repair upon component failure (default). |
|
Inspection Period value > 0 |
Element checked every [Inspection Period] hours. If failed, sent to repair. |
RAM Commander applies the value in the Inspection period field to all RBD elements that do not have a defined inspection time (marked as ---) in the Element parameters definition dialog box.
| 4. | Choose OK. |
| 5. | From the Calculation menu, choose Monte Carlo. |
| 6. | RAM Commander conducts the simulation and displays resulting report and graph: |
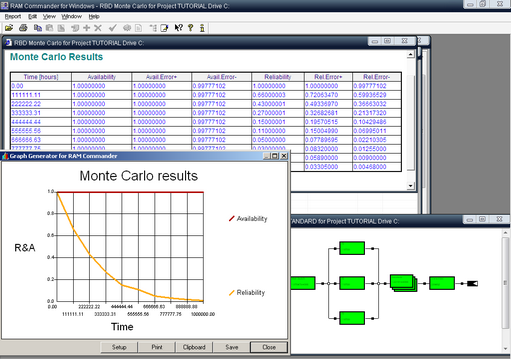
The report contains Reliability (reliability is a probability of failure at time t) and Availability (probability that the system is operating at time t) figures for each selected time point (according to Monte-Carlo settings, max.time and number of points). For Reliability and Availability, upper and lower limit estimation according to Confidence level selected on Monte-Carlo configuration screen. MTBCF (mean time between critical failures) is also calculated.
You may view, print, save, customize and export the generated report and graph (see Fundamentals - Reports and Graphs).